Dashboard
The Dashboard contains clickable graphical items that display informative charts, item counts or issues that may require attention, for example, provisioning errors or unprocessed payments.
Note: Your permissions determine the items you see on the Dashboard.
Dashboard tiles
Each tile item displays a count of items it is reporting. Click on a tile to display further information.
Colour-coding is used to highlight the status of each tile:

- A blue tile identifies a value displayed for informational purposes.

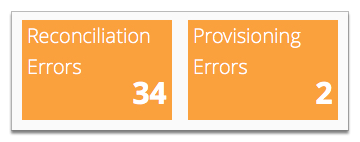
- An orange tile identifies a warning for a value that may require attention.

- A red tile identifies where an error has occurred and Smile has been unable to compute the value of the item being reported.
The following screenshot shows an example of the Reconciliation Errors and Provisioning Errors tiles. Click on a tile to see a list of errors.
Figure: Dashboard tiles

Dashboard charts
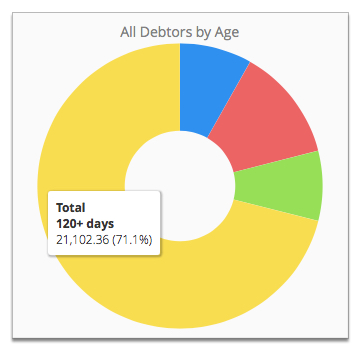
Charts provide a graphical view of a report. Hover over a segment of the chart to view the report detail.
Figure: A chart on the Dashboard
