Charts
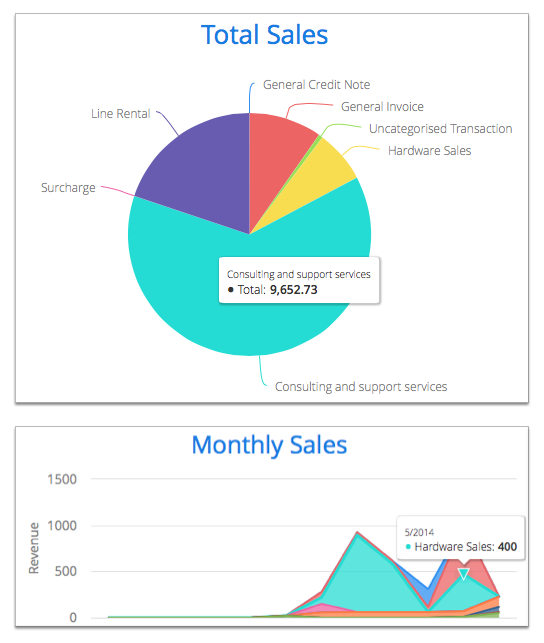
When working with charts you can see additional information about the data points or chart areas by hovering over the relevant area. A label is displayed with the name of the data collection and the total it represents.
The following screenshots show examples of labels displayed on a pie chart and a line chart.
Figure: Examples of labels displayed on charts
