Report formats
The majority of Analytic reports are displayed in table format. Reports that can also be
displayed in chart format are identified in the Analytics Menu Tree with the
![]() icon.
icon.
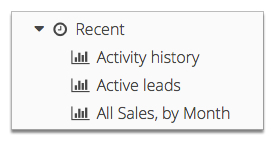
The following screenshot shows reports in the Recent menu identified with a chart icon.
Figure: The Recent menu displaying reports that are available in chart format
You can switch between chart and table format of a report by clicking
![]() or
or
![]() in the report icon set at the top right of the report.
in the report icon set at the top right of the report.